Here’s the deal: You’ve got four economic releases that supposedly move markets, but most investors treat them like they’re all created equal. Spoiler alert: they’re not. One of them can make or break your portfolio in 30 seconds, another one gives you a crystal ball into the future, and the other two? Well, let’s just say they’re more useful for cocktail party conversation than actual money-making.
The Economic Data Food Chain (AKA Your Monthly Money-Moving Schedule)
Think of these four releases like your monthly relationship drama, but with your portfolio. Each one plays a different role, and if you don’t know who’s who, you’re going to get hurt.
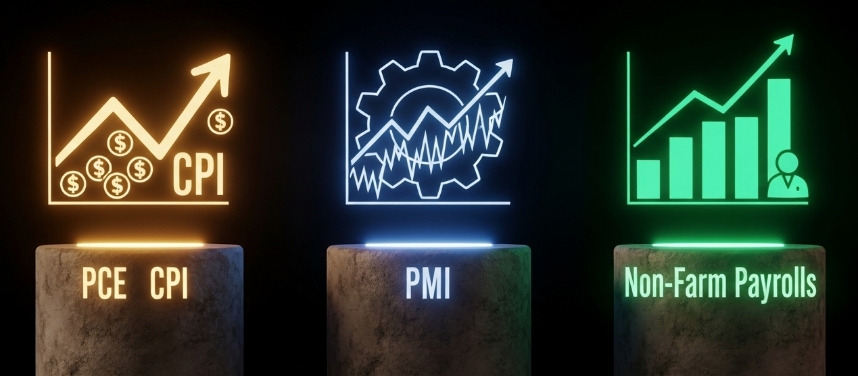
Non-Farm Payrolls: The Drama Queen This is your monthly market earthquake that shows up the first Friday and makes everything about itself. When it’s good, everyone’s happy. When it’s bad, your portfolio throws a tantrum that lasts for days. Employment drives everything from your neighbor’s spending habits to whether Jerome Powell sleeps well at night.
PMI: The Fortune Teller Released first in the monthly cycle, PMI is like that friend who always knows the gossip before everyone else. Business managers spill the tea about what’s really happening in their companies before it shows up anywhere else. When PMI says manufacturing is picking up, you better believe those industrial stocks are about to move.
CPI: The Attention Seeker CPI loves the spotlight and makes sure everyone knows when inflation is rising. Great for headlines, terrible for actual investment decisions because it’s not even what the Fed uses. It’s like dating someone who looks perfect on Instagram but can’t hold a real conversation.
PCE: The Puppet Master Quiet, understated, but actually runs the show. The Fed worships this number, which means it controls interest rates, which means it controls your entire financial future. PCE doesn’t need to be loud because it has all the real power.
Why Non-Farm Payrolls Is Your Portfolio’s Best Friend (Or Worst Enemy)
Value Proposition: Get 72 hours advance notice of the biggest market moves each month.
Non-Farm Payrolls is like that one friend who can make or break your entire weekend plans. When the employment report drops the first Friday of each month, it can move the S&P 500 3% in either direction faster than you can say “unemployment rate.”
Here’s your money-making edge: the details matter more than the headline. Everyone focuses on the unemployment rate, but smart money watches average hourly earnings for wage inflation signals and labor force participation for structural employment trends. When hourly earnings spike above 4% annually, start buying financials because rate hikes are coming. When participation drops below 63%, start buying defensive stocks because recession fears will dominate.
The real insider move? PMI employment data comes out days before Non-Farm Payrolls, giving you a preview of the preview. If PMI employment tanks but everyone expects a strong jobs report, you’ve got yourself a beautiful contrarian setup.
PMI: Your Economic Crystal Ball (That Actually Works)
Value Proposition: Know which sectors will outperform before earnings season even starts.
PMI is like having a direct line to purchasing managers at major corporations who control billions in spending decisions. When they say new orders are picking up, that’s future revenue growth that hasn’t hit corporate earnings yet. When they say inventory is too high, that’s future production cuts that will show up in employment data months later.
The sector breakdown is pure gold. Services PMI above 52 while manufacturing PMI stays below 50? Time to rotate from industrial stocks into tech and consumer services. It’s that simple, and it works because these purchasing managers are literally the people making the decisions that drive corporate profits.
Manufacturing PMI employment components give you a sneak peek at Friday’s jobs report. If manufacturing employment in PMI shows contraction while services employment holds steady, you know exactly which sectors will drive the payroll numbers before anyone else figures it out.
CPI: The Master of Misdirection (Don’t Fall For It)
Value Proposition: Learn to fade the headlines while everyone else panics.
CPI is the economic equivalent of reality TV, all drama and no substance. It generates the biggest headlines about inflation, but here’s the dirty secret: the Fed doesn’t even use it for policy decisions. They use PCE, which consistently runs about 0.3% lower due to how housing costs are calculated.
Your trading edge comes from understanding this gap. When CPI comes in hot and Treasury yields spike immediately, experienced investors often fade that move because they know PCE data later might tell a completely different story. It’s like knowing the movie trailer is better than the actual film.
CPI does have one useful purpose: short-term volatility trades. When CPI shows energy prices spiking, energy stocks often rally on the headline regardless of actual supply and demand. When CPI shows shelter costs cooling, real estate stocks get relief even if the housing market fundamentals haven’t changed. Just don’t mistake this for actual fundamental analysis.
PCE: The Quiet Power Behind Your Portfolio’s Fate
Value Proposition: Position for Fed policy changes before they happen.
PCE is like that soft-spoken person in the meeting who everyone actually listens to when they finally speak. The Fed has explicitly told you they target 2% PCE inflation, which means every tenth of a percent above or below that target directly affects your borrowing costs, stock valuations, and bond returns.
When core PCE runs at 2.9% versus the Fed’s 2% target, that’s not just a statistical miss, that’s a 45% policy failure that forces them to keep rates higher for longer. Your growth stocks suffer, your bonds lose value, and your variable-rate debt gets more expensive. When core PCE drops toward 2%, rate cuts accelerate and everything reverses.
The composition matters for long-term sector allocation. When services inflation in PCE runs hot while goods inflation stays cool, companies in services sectors can raise prices and protect margins. Manufacturing companies get squeezed. This dynamic can persist for years, not months.
Your Monthly Economic Data Trading Calendar
Week 1: PMI Release Position for sector rotation based on manufacturing versus services strength. Use employment components to set up for jobs report positioning.
First Friday: Non-Farm Payrolls Make broad market allocation decisions. Strong jobs support cyclicals and financials. Weak jobs favor defensives and rate-sensitive growth stocks.
Mid-Month: CPI Release Trade the volatility, don’t invest on the fundamentals. Use headline reactions for entry and exit points on existing positions.
Month-End: PCE Release Strategic portfolio rebalancing time. Adjust duration risk, growth versus value allocation, and international exposure based on Fed policy implications.
The Fed’s Secret Priority List (Ranked By What Actually Moves Policy)
The Federal Reserve has basically told you their cheat sheet, but most investors still don’t get it.
Priority 1: PCE for inflation targeting This is their north star. When PCE misses, they adjust policy. Period.
Priority 2: Non-Farm Payrolls for employment mandate Half their job description is maximum employment. When jobs data moves, they move.
Priority 3: PMI for forward-looking context They read PMI surveys in their speeches but don’t base policy on them. It’s like getting gossip from a reliable source.
Priority 4: CPI for public relations They acknowledge CPI exists because everyone talks about it, but they’ve spent years training markets to focus on PCE instead.
Your Options Strategy Cheat Sheet
Non-Farm Payrolls: Monthly options on SPY or QQQ. The moves are big, immediate, and sustained.
PMI: Weekly options on sector ETFs. Sharp moves that often reverse within 24 hours.
CPI: Contrarian plays with weekly options. Fade the initial reaction because PCE will probably contradict it.
PCE: Duration trades with monthly options on TLT or growth versus value rotation plays. These moves stick because they affect fundamental Fed policy.
The Bottom Line: Stop Treating All Data Like It’s Equal
Here’s what separates winning investors from perpetual headline chasers: they understand each economic release serves a different purpose and use them accordingly.
PMI for early sector positioning. Non-Farm Payrolls for broad market direction. CPI for volatility trading and headline fading. PCE for strategic Fed policy positioning.
The real money isn’t made by picking the “most important” indicator. It’s made by understanding how they work together to give you a complete picture that most investors never assemble. Use PMI to identify opportunities, Non-Farm Payrolls to time broad market moves, CPI to manage headline risk, and PCE to position for Fed policy changes.
Master this system, and you’ll be making money from economic data while everyone else is still arguing about which number matters most. Spoiler alert: they all matter, just for different reasons and different time horizons.


