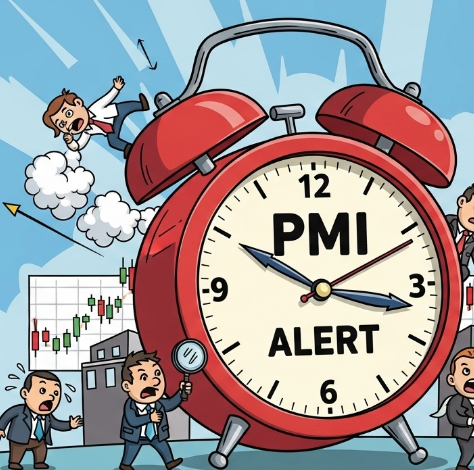
Here’s the situation: We’re just days away from critical PMI releases this week. These aren’t just numbers, they’re early warning signals that could reshape your portfolio before everyone else catches on. If you’re not positioned for what’s coming, you’re already behind.
What August’s Split Personality Revealed And Why You Should Care
Let me break down what happened in August that has smart money repositioning right now. Manufacturing PMI came in at 48.7%, that’s six straight months of contraction, but here’s the kicker: it actually improved from July’s 48.0%. Meanwhile, Services PMI hit 52.0%, showing solid expansion and jumping nearly 2 points from July’s barely-above-water 50.1%.
What this split tells you: The economy is literally divided. Manufacturing is getting hammered by trade tensions and inventory adjustments, while services are thriving on domestic demand. If you’re overweight in industrial stocks without understanding this dynamic, you’re exposed.
The real eye-opener? New Orders in manufacturing finally turned positive at 51.4% after six months of decline. That’s a 4.3-point jump that signals businesses might be done cutting back. But here’s where it gets interesting for your money, this could be the last gasp of tariff-driven front-loading or the real beginning of a recovery.
Your Portfolio’s Hidden PMI Exposure
Most investors don’t realize how PMI data directly impacts their returns. Here’s your reality check.
Manufacturing PMI below 50 means your industrial ETFs, materials stocks, and cyclical plays get punished. Think Caterpillar, 3M, and most manufacturing-heavy mutual funds.
Services PMI above 52 means your consumer discretionary holdings, financial services stocks, and domestic-focused companies rally. This includes everything from restaurants to regional banks.
The gap between them matters too. When services outperform manufacturing by 3+ points like we’re seeing now, you get sector rotation that can move 10-15% of your portfolio in weeks.
Current opportunity: August’s data shows manufacturing might be bottoming while services remain strong. If Friday confirms this pattern, you’re looking at a potential value rotation that could reward patient investors who positioned early.
Friday’s Three Scenarios: Where Your Money Should Go
Scenario One is Manufacturing Bounces Back with about 35% probability. Friday’s PMI hits 50+ for the first time since March and industrial stocks explode higher with 5-8% single-day moves possible. Materials and energy sectors outperform while value stocks crush growth in the rotation. Your play here is loading up on beaten-down industrials before the data. Consider XLI or individual names like Honeywell and Boeing suppliers.
Scenario Two is Services Stay Strong Manufacturing Stays Weak with about 50% probability. Manufacturing remains below 50 while Services stay above 52. You get continued sector divergence creating trading opportunities. Consumer discretionary and financials keep leading while tech and services maintain premium valuations. Your play is sticking with domestic-focused services plays. Consider XLF and consumer names with strong U.S. exposure.
Scenario Three is Both Sectors Weaken with about 15% probability. Manufacturing drops further and Services slip below 52. Risk-off mode triggers flight to quality, bond yields drop, growth stocks benefit short-term, and recession fears resurface. Your play becomes defensive positioning in utilities, consumer staples, and high-quality bonds. This is the scenario where cash becomes king.
The Tariff Trade: Reading Between the PMI Lines
Here’s what most analysts are missing: PMI data now reflects trade policy more than traditional economic cycles. August’s manufacturing “improvement” to 48.7% might actually be the last hurrah of companies front-loading inventory before tariff impacts fully hit.
Your edge: This Friday’s data will be critical to watch. If manufacturing PMI drops below 47%, you’re looking at a genuine policy-induced recession in that sector. If it holds above 48.5%, businesses are adapting better than expected.
Smart positioning means companies with domestic supply chains are your winners. Businesses dependent on complex international sourcing are your losers. The PMI’s sub-components on supplier deliveries and inventory will tell you everything about supply chain stress.
Services PMI: Your Inflation Early Warning System
While everyone watches the Fed for inflation signals, Services PMI gives you advance notice. August’s 52.0% reading with accelerating business activity at 55% means domestic demand is running hot. That’s inflationary pressure building in real-time.
What this means for your portfolio: Rising services inflation benefits companies with pricing power but hurts margin-squeezed businesses. Strong domestic demand rewards U.S.-focused companies but penalizes export-dependent firms. Service sector strength supports real estate, consumer services, and domestic banks.
Friday catalyst: If Services PMI hits 53+ while input prices rise, watch the price sub-index, you’re looking at renewed inflation pressure that could pause Fed rate cuts. That scenario favors value over growth and shorter-duration bonds over longer ones.
The Employment Component Everyone Ignores
PMI employment data arrives 4 days before the jobs report, giving you a trading edge most investors never use. August manufacturing employment hit 45.2% showing contraction while services employment was 50.2% barely expanding.
Portfolio impact: Strong employment components in both sectors equals cyclical stock rally. Weak employment across both equals defensive positioning time.
Sector Rotation Plays for This Week’s PMI
Before the data, position now. If you believe in a contrarian manufacturing bet and think there’s a PMI bounce, buy beaten-down industrials. For a continuation services play, if you think the trend continues, add to domestic-focused service names. To hedge your bets, pair long services with short manufacturing ETFs.
After the data, react quickly. Manufacturing surprise upside means industrial stocks could gap up 3-5% immediately. Services disappointment triggers the first sign of services weakness and defensive rotation. Both sectors strong means risk-on mode benefits cyclicals and value names.
Your Options Strategy for PMI Volatility
PMI releases create predictable volatility patterns you can profit from.
Pre-release positioning: Buy straddles on industrial ETFs if you expect big moves but aren’t sure of direction. XLI options are typically liquid and responsive to PMI surprises.
Post-release momentum: PMI surprises often create 2-3 day momentum moves in affected sectors. Use this for quick profits on directional bets.
Earnings correlation: Companies reporting after PMI releases often see their reactions amplified by the data. Use this for individual stock plays.
The China Connection You Can’t Ignore
This week’s PMI data arrives amid China’s latest stimulus measures. If U.S. manufacturing PMI improves while Chinese demand picks up, you’re looking at a double catalyst for global industrial stocks.
Your international play: Consider emerging market industrial exposure if both U.S. and Chinese PMI data improve simultaneously. FXI and EWZ could benefit from coordinated global manufacturing recovery.
Timing Your Moves: The PMI Calendar Advantage
Monday through Thursday is when you position for Friday’s PMI releases. Friday at 10 AM ET brings both Manufacturing and Services PMI releases creating immediate sector rotation opportunity. Friday afternoon is for digesting implications for next week’s positioning.
Pro tip: The 30 minutes after the release often see the biggest moves. Have your orders ready and be prepared to act fast.
The Bottom Line: PMI as Your Economic GPS
Most investors treat PMI data as backward-looking noise. Smart money uses it as forward-looking intelligence. These surveys capture business sentiment before it shows up in earnings, employment data, or GDP numbers.
Your competitive advantage: This Friday’s PMI releases will tell you whether the manufacturing recession is ending or deepening, whether services strength is sustainable or starting to crack, whether the economic split between sectors is widening or healing, and whether tariff impacts are manageable or economy-threatening.
The big picture: We’re at an inflection point where PMI data matters more than usual. With the Fed cutting rates, trade policies reshaping supply chains, and election uncertainty building, business managers’ real-time assessments, which PMI captures, are your best guide to what’s actually happening in the economy.
Your action plan: Don’t just read the headlines when PMI data hits this Friday. Use the sector-by-sector breakdown, employment components, and price indicators to position your portfolio ahead of the crowd. These releases could be the catalyst that breaks this economy and your portfolio in either direction.
Remember: In markets, it’s not about predicting the future perfectly. It’s about positioning for multiple scenarios and having the agility to adapt when new information arrives. PMI data gives you that information before most investors even know to look for it.


